Holter Monitor Interpretation: A Comprehensive Guide
Decoding Holter reports requires understanding rhythm analysis, ST-segment changes, and HRV; PDF resources offer detailed guides for cardiac care, arrhythmia detection, and artifact identification.
What is a Holter Monitor?
A Holter monitor is a portable device used to record the electrical activity of the heart for an extended period, typically 24-72 hours, or even longer with modern wearable options. Unlike a standard electrocardiogram (ECG) which captures a snapshot in time, a Holter monitor provides a continuous recording, crucial for detecting intermittent arrhythmias that might be missed during a brief clinical visit.
Named after Norman J. Holter, who pioneered the technology in the late 1940s, these monitors are small boxes patients can carry while maintaining their normal daily activities. The device connects to electrodes placed on the chest, continuously tracking the heart’s rhythm. PDF guides on Holter interpretation emphasize the importance of this continuous monitoring for diagnosing conditions like atrial fibrillation and premature ventricular contractions. Modern devices, like wearable smart ECG clothing, are enhancing accessibility and comfort.
The History of Holter Monitoring (Norman J; Holter)
Norman J. Holter, a pioneering biomedical engineer, revolutionized cardiac diagnostics in the late 1940s. Recognizing the limitations of standard ECGs in capturing infrequent arrhythmias, he developed a portable ECG recording system – the Holter monitor. Initially, the system involved carrying bulky tape recorders, a far cry from today’s compact devices.
Holter’s innovation allowed for continuous heart rhythm monitoring during a patient’s daily life, revealing previously undetected abnormalities. His work, alongside that of Bernard Lown, significantly advanced the understanding and treatment of heart disease. PDF resources detailing Holter interpretation often acknowledge Holter’s foundational contribution. Modern advancements, including wearable Holter monitors and sophisticated analysis software, build upon his original vision, improving diagnostic accuracy and patient care.
Indications for Holter Monitoring
Holter monitoring is crucial when evaluating intermittent symptoms potentially linked to cardiac arrhythmias. Common indications include palpitations, unexplained dizziness or syncope, and near-syncope episodes. Physicians often request Holter monitoring to investigate suspected arrhythmias not captured during a standard ECG, particularly those occurring during daily activities.
It’s also valuable in assessing the effectiveness of antiarrhythmic medications and identifying potentially dangerous arrhythmias like atrial fibrillation or ventricular tachycardia. Furthermore, Holter monitoring aids in diagnosing bradycardia or heart block. PDF guides on Holter interpretation emphasize correlating symptoms with ECG findings. The test helps determine if symptoms are truly cardiac in origin, guiding appropriate treatment strategies and improving patient outcomes.
Types of Holter Monitors: Lead Configurations (3-Lead vs. 12-Lead)
Holter monitors primarily come in two lead configurations: 3-lead and 12-lead. 3-lead Holter monitors are more common for general arrhythmia detection, providing a basic overview of heart rhythm. They are simpler to apply and often used for initial assessments. However, 12-lead Holter monitors, like those from Philips and GE Healthcare, offer a more comprehensive view of the heart’s electrical activity.
This enhanced detail is crucial for identifying subtle arrhythmias and pinpointing their origin within the heart. PDF resources on Holter interpretation highlight the advantages of 12-lead systems for diagnosing complex arrhythmias and differentiating between various types of heart block. The choice depends on the clinical question; 12-lead is preferred for detailed analysis, while 3-lead suffices for routine monitoring.
Wearable Holter Monitors & Modern Cardiology Practices
Modern cardiology is increasingly adopting wearable Holter monitors, enhancing patient comfort and diagnostic capabilities. Devices like the Smart ECG Clothing and UltraLinQ systems allow for continuous, long-term monitoring – even up to seven days – without significantly restricting patient activity. This is a significant advancement over traditional, box-like Holter units.
PDF guides on Holter interpretation emphasize the importance of understanding potential artifacts from patient movement with these wearable devices. ’s 12-lead smart ECG clothing exemplifies this trend, offering real-time data and expert reports via mobile apps. These innovations streamline cardiac care, making it more accessible and scalable, while improving arrhythmia detection rates and patient compliance.

Duration of Holter Monitoring (24-Hour, 7-Day, Continuous)
Holter monitoring duration varies based on clinical need, ranging from the standard 24-hour assessment to extended 7-day or even continuous monitoring. While 24-hour recordings are common for intermittent symptoms, longer durations increase the chance of capturing infrequent arrhythmias. PDF resources dedicated to Holter interpretation highlight the benefits of prolonged monitoring for elusive symptoms.
Continuous monitoring, akin to inpatient cardiac monitoring, is reserved for critically ill patients. Newer single-lead disposable options facilitate 7-day recordings, while 3-lead systems also offer extended duration. Understanding the limitations of each duration is crucial; interpretation guides emphasize correlating findings with patient symptoms and the monitoring timeframe.

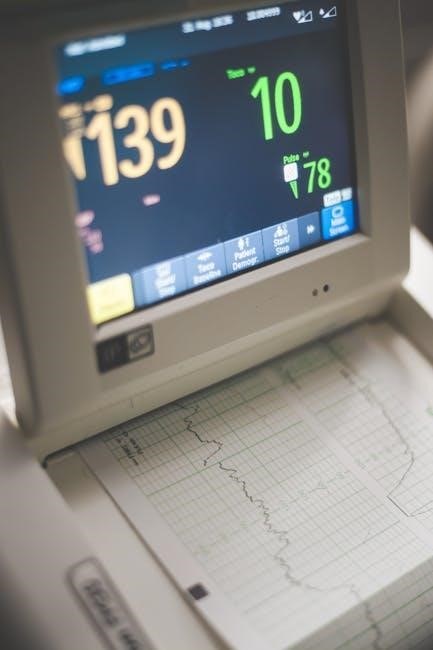
Understanding the Holter Monitor Report
Holter reports detail heart rate, rhythm, and ST-segment analysis; PDF guides clarify these components, aiding in arrhythmia identification and artifact recognition for accurate cardiac assessment.
Basic Components of a Holter Report
A comprehensive Holter report typically includes several key components crucial for accurate interpretation. Firstly, a rhythm strip provides a visual representation of the heart’s electrical activity throughout the monitoring period. Secondly, heart rate variability (HRV) data is presented, showcasing fluctuations in the time intervals between heartbeats.
Detailed event summaries highlight any detected arrhythmias, such as atrial fibrillation or premature ventricular contractions (PVCs), including their frequency and duration. ST-segment analysis identifies potential ischemic changes, while T-wave abnormalities may indicate electrolyte imbalances or other cardiac issues.
PDF resources dedicated to Holter interpretation often provide annotated examples of these components, aiding in understanding. Furthermore, reports include patient demographics, monitoring duration, and technical notes regarding any artifacts or interference encountered during recording. Understanding these basic elements is fundamental for effective cardiac assessment.
Heart Rate Analysis
Heart rate analysis within a Holter report involves evaluating both average heart rate and its variability throughout the monitoring period. PDF guides emphasize assessing for sustained tachycardia (rapid heart rate) or bradycardia (slow heart rate), noting the duration and context of these episodes.
Sinus rhythm, the normal heart rhythm, should be confirmed as the underlying rhythm. Deviations from sinus rhythm, such as sinus arrhythmia (irregular rhythm), are also documented. Maximum and minimum heart rates are reported, providing a range of cardiac activity.
Heart rate recovery after exercise or exertion is an important parameter, indicating cardiovascular fitness. PDF resources often illustrate normal and abnormal heart rate patterns. Analyzing heart rate trends helps identify potential underlying cardiac conditions and guides further diagnostic evaluation and treatment strategies.
Rhythm Analysis: Identifying Arrhythmias
Rhythm analysis is central to Holter monitoring, focusing on detecting and classifying arrhythmias – irregular heartbeats. PDF interpretation guides detail common arrhythmias like atrial fibrillation (AFib), premature ventricular contractions (PVCs), and supraventricular tachycardia (SVT).
The report will quantify the frequency of these arrhythmias, noting the number of events and their patterns. Bigeminy (every other beat is premature) and trigeminy (every third beat is premature) are specifically identified.
PDF resources emphasize differentiating benign arrhythmias from potentially dangerous ones, like ventricular tachycardia (VT). Accurate arrhythmia identification is crucial for risk stratification and guiding appropriate clinical interventions, including medication or further cardiac evaluation. Understanding the clinical context is vital for proper interpretation.
ST-Segment and T-Wave Analysis
ST-segment and T-wave morphology provide insights into myocardial ischemia and repolarization abnormalities. PDF Holter interpretation guides highlight the significance of ST-segment elevation or depression, as well as T-wave inversion, potentially indicating reduced blood flow to the heart muscle.
However, these changes aren’t always indicative of cardiac issues; artifact and non-cardiac factors can mimic ischemic patterns. PDF resources stress the importance of correlating ST-T wave changes with patient symptoms and other clinical data.
suggests these changes are only guiding, not definitive. Analyzing trends and the duration of these abnormalities is crucial. Careful review, aided by detailed PDF guides, helps differentiate benign variations from clinically significant findings requiring further investigation.
Interbeat Interval Variability (HRV)
Interbeat interval variability (HRV), reflecting the fluctuations in time between heartbeats, is a key component of Holter monitor interpretation. PDF guides emphasize that higher HRV generally indicates better cardiac health and adaptability, while reduced HRV can signal underlying pathology.
Analyzing HRV requires specialized software and understanding of various HRV metrics. PDF resources detail how to assess these metrics, identifying patterns associated with conditions like heart failure, ischemia, and autonomic dysfunction.
Factors like age, fitness level, and stress can influence HRV. Therefore, PDF interpretation guides stress the importance of considering the patient’s overall clinical context when evaluating HRV data. Accurate HRV analysis, supported by comprehensive PDF documentation, aids in risk stratification and treatment planning;

Common Arrhythmias Detected by Holter Monitoring
Holter monitoring identifies AFib, PVCs, SVT, bradycardia, and VT; PDF guides detail arrhythmia recognition, diagnostic criteria, and clinical significance for accurate interpretation.
Atrial Fibrillation (AFib)
Atrial fibrillation, detected via Holter monitoring, presents as irregular, often rapid, atrial activity on the ECG. PDF interpretation guides emphasize identifying the absence of discernible P waves, replaced by fibrillatory waves, and an irregularly irregular ventricular rhythm. Accurate AFib detection requires assessing the atrial rate, often exceeding 300 bpm, and quantifying the percentage of time spent in AFib during the monitoring period.
Holter reports often include metrics like the AFib burden, crucial for risk stratification and treatment decisions. PDF resources detail differentiating AFib from atrial flutter and other supraventricular tachycardias. Recognizing paroxysmal, persistent, and long-standing persistent AFib is vital, as management strategies differ. Furthermore, PDFs highlight the importance of correlating AFib findings with patient symptoms and clinical context for comprehensive evaluation.
Premature Ventricular Contractions (PVCs)
Holter monitoring identifies Premature Ventricular Contractions (PVCs) as early beats originating in the ventricles, characterized by wide and bizarre QRS complexes not preceded by a P wave. PDF interpretation guides stress quantifying PVC frequency – unifocal vs. multifocal – and analyzing patterns like bigeminy or trigeminy. Assessing PVC morphology is crucial; benign PVCs typically have a normal axis and QRS duration.
PDF resources detail differentiating PVCs from more serious ventricular arrhythmias. Frequent PVCs, especially those exhibiting R-on-T phenomenon, warrant further investigation. Holter reports often calculate the percentage of PVCs relative to total beats. PDFs emphasize correlating PVC burden with symptoms like palpitations or dizziness, guiding clinical decisions. Understanding PVC triggers, like stress or caffeine, aids patient management, as detailed in comprehensive interpretation PDFs.
Supraventricular Tachycardia (SVT)
Holter monitoring effectively captures Supraventricular Tachycardia (SVT) episodes – rapid heart rhythms originating above the ventricles. PDF interpretation guides highlight identifying SVT by its regular, narrow QRS complex tachycardia, often with absent P waves or retrograde P waves. Differentiating SVT from atrial fibrillation is key, relying on P wave visibility and rhythm regularity.
PDF resources detail various SVT subtypes – AVNRT, AVRT (Wolff-Parkinson-White syndrome), atrial tachycardia – each with unique ECG characteristics. Holter reports document SVT episode duration, frequency, and termination mechanisms. PDFs emphasize correlating SVT episodes with patient symptoms like palpitations, dizziness, or shortness of breath. Analyzing SVT triggers, such as exercise or stress, aids diagnosis. Comprehensive interpretation PDFs guide clinicians in determining appropriate management strategies, including pharmacological or ablative interventions.
Bradycardia and Heart Block
Holter monitoring is crucial for detecting bradycardia (slow heart rate) and heart block, conditions often intermittent and missed on standard ECGs. PDF interpretation guides emphasize identifying bradycardia as a heart rate consistently below 60 bpm, while heart block is categorized by degrees – first, second (Mobitz I & II), and third-degree (complete).
PDF resources detail ECG patterns for each block type: prolonged PR intervals (first-degree), varying PR intervals with dropped beats (Mobitz I), fixed PR intervals with dropped beats (Mobitz II), and complete dissociation of P waves and QRS complexes (third-degree). Holter reports document the duration and severity of bradycardia/block, correlating with symptoms like fatigue, dizziness, or syncope. PDFs highlight the importance of assessing for nocturnal bradycardia, common in asymptomatic individuals. Accurate interpretation PDFs guide clinicians in determining the need for pacing or medication.
Ventricular Tachycardia (VT)
Ventricular tachycardia (VT), a potentially life-threatening arrhythmia, requires prompt detection via Holter monitoring. PDF interpretation guides emphasize recognizing VT as a rapid, wide-complex tachycardia originating from the ventricles. PDF resources detail differentiating VT from supraventricular tachycardia with aberrancy, often challenging. Key features include a rate exceeding 100 bpm, QRS duration >120ms, and absence of P waves.
Holter reports document VT episodes’ duration, frequency, and morphology. PDFs highlight the importance of assessing for sustained VT (lasting >30 seconds) versus non-sustained VT. Interpretation PDFs guide clinicians in identifying monomorphic (uniform QRS morphology) versus polymorphic VT (varying morphology, like Torsades de Pointes). Correlation with symptoms – palpitations, dizziness, syncope – is crucial. PDFs stress the need for immediate evaluation and potential intervention, including antiarrhythmic drugs or implantable cardioverter-defibrillators (ICDs).

Potential Interference & Artifacts
Holter PDF guides detail recognizing interference from WiFi, muscle, and movement; proper artifact identification is crucial for accurate interpretation and diagnosis.
Electromagnetic Interference (WiFi, Mobile Networks)
Holter monitor interpretation PDFs extensively cover electromagnetic interference (EMI) as a significant source of artifact. Modern environments are saturated with WiFi signals and mobile network transmissions, both capable of inducing noise into the ECG signal. These interferences manifest as spurious spikes or waves on the recording, potentially mimicking or obscuring genuine cardiac events.
PDF guides emphasize patient education regarding minimizing exposure during the monitoring period – advising against prolonged use of mobile phones directly against the body or close proximity to strong electromagnetic sources. Understanding the frequency characteristics of common EMI sources helps differentiate them from physiological signals. Advanced filtering techniques, often described in detailed reports, are employed to reduce the impact of EMI, but complete elimination is rarely achievable. Accurate interpretation relies on recognizing patterns consistent with interference and not misinterpreting them as arrhythmias.
Patient Movement Artifact
Holter monitor interpretation PDFs dedicate substantial sections to recognizing and mitigating patient movement artifact. This common source of error arises from muscle contractions and electrode displacement during daily activities. Artifacts appear as erratic, high-frequency signals that can resemble or mask true cardiac rhythms, complicating accurate interpretation.
Guides detail how to identify movement artifact based on its morphology and correlation with documented patient activity. PDF resources stress the importance of patient instruction – advising them to record any movements (e.g., exercising, lifting heavy objects) in their diary. Sophisticated algorithms attempt to filter out these artifacts, but their effectiveness varies. Clinicians must critically evaluate segments flagged as potentially artifactual, considering the patient’s activity log and the overall clinical context to avoid misdiagnosis. Proper electrode adhesion is also crucial to minimize this issue.
Muscle Artifact
Holter monitor interpretation PDFs extensively cover muscle artifact, a frequent challenge in accurate ECG analysis. This interference stems from electrical activity generated by skeletal muscles, often mimicking cardiac signals. It’s particularly prevalent when electrodes are positioned near muscle groups or during periods of physical activity, creating baseline wander and sharp deflections.
These guides emphasize recognizing muscle artifact’s characteristic appearance – typically low-amplitude, irregular waveforms. They highlight the importance of patient diaries, where documented activities help correlate artifact with movement. Advanced filtering techniques are discussed, though PDFs caution against over-reliance, as they can distort genuine ECG features. Clinicians are advised to assess the clinical plausibility of rhythms occurring during periods of documented muscle activity. Proper electrode placement, minimizing contact with muscle bellies, is a key preventative measure detailed in these resources.
Baseline Wander
Holter monitor interpretation PDFs dedicate significant attention to baseline wander, a common artifact obscuring accurate ECG readings. This slow, undulating drift of the baseline is often caused by patient movement, respiration, or poor electrode contact. PDFs explain that it can mimic ST-segment elevation or depression, potentially leading to misdiagnosis of ischemia.
These resources detail recognizing baseline wander by its slow frequency and smooth, undulating shape, differentiating it from genuine cardiac events. They emphasize the importance of proper electrode application and skin preparation to minimize movement artifact. Filtering techniques are discussed, but PDFs caution against excessive filtering, which can distort true ECG morphology. Correlating baseline wander with patient activity documented in their diary is crucial for accurate interpretation. Understanding Frank lead systems’ superior interference resistance, as noted in some PDFs, aids in minimizing this artifact.
Holter Monitor Technology & Brands
PDF guides detail brands like Philips, GE Healthcare, and Mortara; wearable ECG clothing and home-use devices are also covered for Holter interpretation.
Philips Holter Systems (5-Channel 12-Lead)
Philips offers advanced Holter systems, notably their 5-channel 12-lead configuration, providing comprehensive cardiac data for detailed interpretation. Accessing PDF resources from Philips and third-party cardiology education platforms is crucial for mastering the nuances of analyzing reports generated by these systems. These PDF guides often focus on identifying subtle arrhythmias, ST-segment variations, and interpreting the higher resolution data afforded by the 12-lead setup.
Understanding the Philips system’s specific algorithms and noise reduction techniques, as detailed in their documentation (often available as PDF downloads), is vital. Clinicians benefit from learning how to differentiate genuine cardiac events from artifacts, a skill honed through studying example reports and case studies found in specialized Holter interpretation PDF materials. The 5-channel design enhances diagnostic accuracy, particularly for detecting subtle ischemic changes and complex arrhythmias, making thorough PDF-based training essential.
GE Healthcare Holter Monitors (SpaceLabs)
GE Healthcare’s SpaceLabs Holter monitors are renowned for their robustness and data quality, demanding skilled interpretation. Comprehensive PDF guides focusing on SpaceLabs systems are invaluable for clinicians. These resources detail specific algorithms used for arrhythmia detection and ST-segment analysis, crucial for accurate diagnosis. Mastering the nuances of GE’s signal processing techniques, often explained in downloadable PDF manuals, is essential.
Effective Holter interpretation with SpaceLabs requires understanding potential artifacts and interference, topics thoroughly covered in specialized PDF training materials. Clinicians benefit from studying example reports and case studies, readily available as PDF downloads, to refine their skills in identifying subtle cardiac events. The advanced features of GE systems necessitate a deep understanding, best achieved through dedicated PDF-based learning and continuous professional development.
Mortara Century 3000
Mortara Century 3000 Holter systems require specialized interpretation skills, best honed with dedicated resources. Detailed PDF manuals provided by Mortara cover the system’s advanced features, including automated event detection and waveform analysis. Mastering these tools is vital for accurate diagnosis. Clinicians benefit from PDF guides focusing on rhythm identification, ST-segment evaluation, and HRV analysis specific to the Century 3000.
Effective Holter interpretation using this system demands understanding potential artifacts and interference, thoroughly explained in downloadable PDF training materials. Accessing case studies and example reports, often available as PDF documents, allows for practical skill development. The Mortara Century 3000’s sophisticated algorithms necessitate a comprehensive understanding, best achieved through continuous learning via dedicated PDF-based resources and professional development.
Good Friend ECG Machine (Home Use)
Good Friend ECG machines, designed for home monitoring, present unique interpretation challenges. While user-friendly, accurate analysis relies on understanding basic ECG principles, often detailed in accompanying PDF guides. These PDF resources typically cover lead placement, rhythm strip analysis, and recognizing common artifacts. However, comprehensive Holter interpretation requires more than basic knowledge.

Users should supplement the provided PDF materials with broader educational resources focusing on arrhythmia detection and ST-segment analysis. While convenient, home-use devices necessitate caution; self-diagnosis is discouraged. PDF documents outlining limitations and when to seek professional medical advice are crucial. Proper interpretation, even with a Good Friend device, benefits from understanding the nuances explained in detailed cardiology PDF guides, ensuring accurate assessment and timely medical intervention.

Smart ECG Clothing (12-Lead Wearable)
Smart ECG clothing, offering 12-lead monitoring, generates complex data requiring specialized interpretation skills. Comprehensive PDF guides are essential for understanding the nuances of 12-lead ECGs, including identifying subtle ST-segment changes and pinpointing the source of arrhythmias. These PDF resources should detail the advantages of 12-lead systems, like identifying interior axis deviations.
Effective interpretation necessitates a strong grasp of cardiac anatomy and electrophysiology, often covered in advanced cardiology PDF materials. Users must learn to differentiate between benign variations and clinically significant findings. While these wearables enhance data capture, accurate analysis relies on detailed PDF-based training. Access to expert-validated PDF guides is crucial for maximizing the diagnostic potential of this technology and avoiding misinterpretations, ensuring appropriate medical follow-up.
Related Posts

danmachi volume 18 pdf
Danmachi Volume 18 PDF: A Comprehensive Guide (Updated 02/05/2026) Today,…

thesis dissertation virus and stress pathways pdf
This exploration bridges academic rigor with immunological responses, examining how…

printable 18 doll clothes patterns pdf free
Free printable patterns for 18” dolls‚ like American Girl‚ are…